
Data-led marketing isn't a buzzword. It's a competitive advantage — but only if you know how to build it properly. Most businesses we audit have more data than they can act on, and no clear system for turning that data into decisions.
This guide covers everything you need to build a marketing function that runs on evidence, not intuition.
💡 Tip
If you're new to analytics, start with the foundations section. If your tracking is already in place, jump straight to attribution and dashboard design.
Why Most Marketing Data Goes Unused
The average marketing team has access to Google Analytics, a CRM, ad platform dashboards, email metrics, and a heatmap tool. That's five sources of data — and most teams look at them in isolation, once a month, in a slide deck that's already two weeks old.
The problem isn't a lack of data. It's a lack of a system that connects data to decisions.
Here's what that looks like in practice:
| Area | What's Tracked | What's Missing |
|---|---|---|
| Paid Media | Clicks, impressions, spend | Revenue attribution, cross-channel assist |
| SEO | Rankings, organic sessions | Conversion rate by landing page, intent mapping |
| Open rate, click rate | Revenue per email, list decay, segment performance | |
| Website | Sessions, bounce rate | Scroll depth, form abandonment, user journeys |
| CRM | Lead volume | Lead quality score, sales cycle length, source attribution |
Building Your Analytics Foundation
Before you can do anything with data, you need to trust it. A broken tracking setup — duplicate pageviews, missing conversion events, incorrect attribution windows — means every insight you draw is built on sand.
Step 1: Audit Your GA4 Setup
GA4 is powerful, but the default installation captures less than you think. You need:
- Enhanced measurement enabled (scrolls, outbound clicks, video engagement, file downloads)
- Custom events for key conversion actions (form submits, phone clicks, booking completions)
- Conversion events properly marked — not just "page_view"
- Data streams connected to the correct domains
- Filters excluding internal traffic and bot traffic
⚠️ Warning
GA4's default session timeout is 30 minutes. For tourism and hospitality businesses with longer research cycles, consider extending this to 60–90 minutes to avoid inflating session counts.
Step 2: Map Your Conversion Events
Every business has a different definition of a conversion. Before you build dashboards or set up attribution, map every meaningful action a user can take:
| Event | Priority | Value |
|---|---|---|
| Booking completed | Primary | $450 avg order value |
| Enquiry form submitted | Primary | $90 estimated value |
| Phone number clicked | Secondary | $45 estimated value |
| Brochure downloaded | Micro | $15 estimated value |
| Newsletter signup | Micro | $8 estimated value |
Step 3: Connect Your Data Sources
A single-source analytics setup is almost always misleading. You need to connect:
- GA4 — web behaviour and on-site conversions
- Google Ads — paid search and display performance
- Meta Ads — social paid performance
- CRM — lead quality and sales outcomes
- Booking engine — actual revenue data
Channel Performance: Where the Budget Should Go
Once your tracking is clean, the first question every client asks is: "Where should I put the money?"
The honest answer is: it depends on your current mix. But data usually tells a clear story.
Average ROAS by channel — Data Story client benchmarks (2024)
Email and SEO consistently deliver the highest ROAS — but they require investment upfront. Paid media scales faster but returns diminish as budgets grow. The optimal mix depends on your stage and objectives.
Attribution: The Hardest Problem in Marketing
Attribution is the question of which marketing touchpoints deserve credit for a conversion. It sounds simple. It isn't.
ℹ️ Info
Google's default attribution model is "last click" — meaning the final touchpoint before conversion gets 100% of the credit. This systematically undervalues brand awareness channels, email, and SEO.
The Models Explained
Last click: Simple, but misleading. Rewards the channel that closes, not the channels that opened the door.
First click: The opposite problem — rewards awareness but ignores conversion optimisation.
Linear: Distributes credit equally across all touchpoints. Better, but treats a brand search the same as a retargeting ad.
Data-driven: GA4's recommended model. Uses machine learning to weight touchpoints based on their actual contribution to conversion. Requires sufficient conversion volume (usually 300+ conversions/month).
For most of our clients, we recommend data-driven attribution in GA4 combined with revenue-level attribution in your CRM. This gives you both the channel-level view and the deal-level view.
Building Dashboards That Drive Decisions
A dashboard that gets looked at once and forgotten is just an expensive spreadsheet. Good dashboards are built around decisions, not data.
Before building any dashboard, answer: What decision will this dashboard help me make each week?
The Three Dashboards Every Marketing Team Needs
1. Weekly Performance Dashboard Answers: Is this week better or worse than last week? Which channels are over- or under-performing?
Metrics: Sessions, conversions, revenue, ROAS by channel, cost per conversion, week-on-week delta.
2. Monthly Strategy Dashboard Answers: Are we on track for quarterly goals? Where should we shift budget?
Metrics: Monthly conversion trend, channel mix, CAC, pipeline value, SEO ranking movement.
3. Campaign-Level Dashboard Answers: Is this specific campaign working? Should we scale, pause, or optimise?
Metrics: Impressions, CTR, CPC, conversion rate, CPA, ROAS, audience performance.
Putting It Together: The Data Story Framework
We use a four-stage framework with every new client:
- Audit — Trust the data first. Fix tracking gaps before making any strategic decisions.
- Baseline — Establish 90-day benchmarks for every key metric. Nothing is good or bad without context.
- Optimise — Use the data to make weekly micro-decisions. Channel mix, bids, copy, audience.
- Scale — Double down on what works. Reallocate from what doesn't.
It sounds straightforward. Most agencies skip step one and go straight to step three. That's why their dashboards lie.
💡 Tip
Want to see how your current analytics setup stacks up? We offer a free analytics audit for businesses in NZ and Australia. Book a call with our team to get started.
This guide is updated regularly as tools and best practices evolve. Last reviewed March 2025.

Written by
Dave Hockly
Director
Dave founded Data Story with a belief that better data leads to better marketing. With over a decade in digital marketing across tourism, hospitality, and growth businesses, he specialises in turning complex analytics into clear business strategy. Dave leads client relationships and oversees the agency's strategic direction.
LinkedInRelated articles
CRM
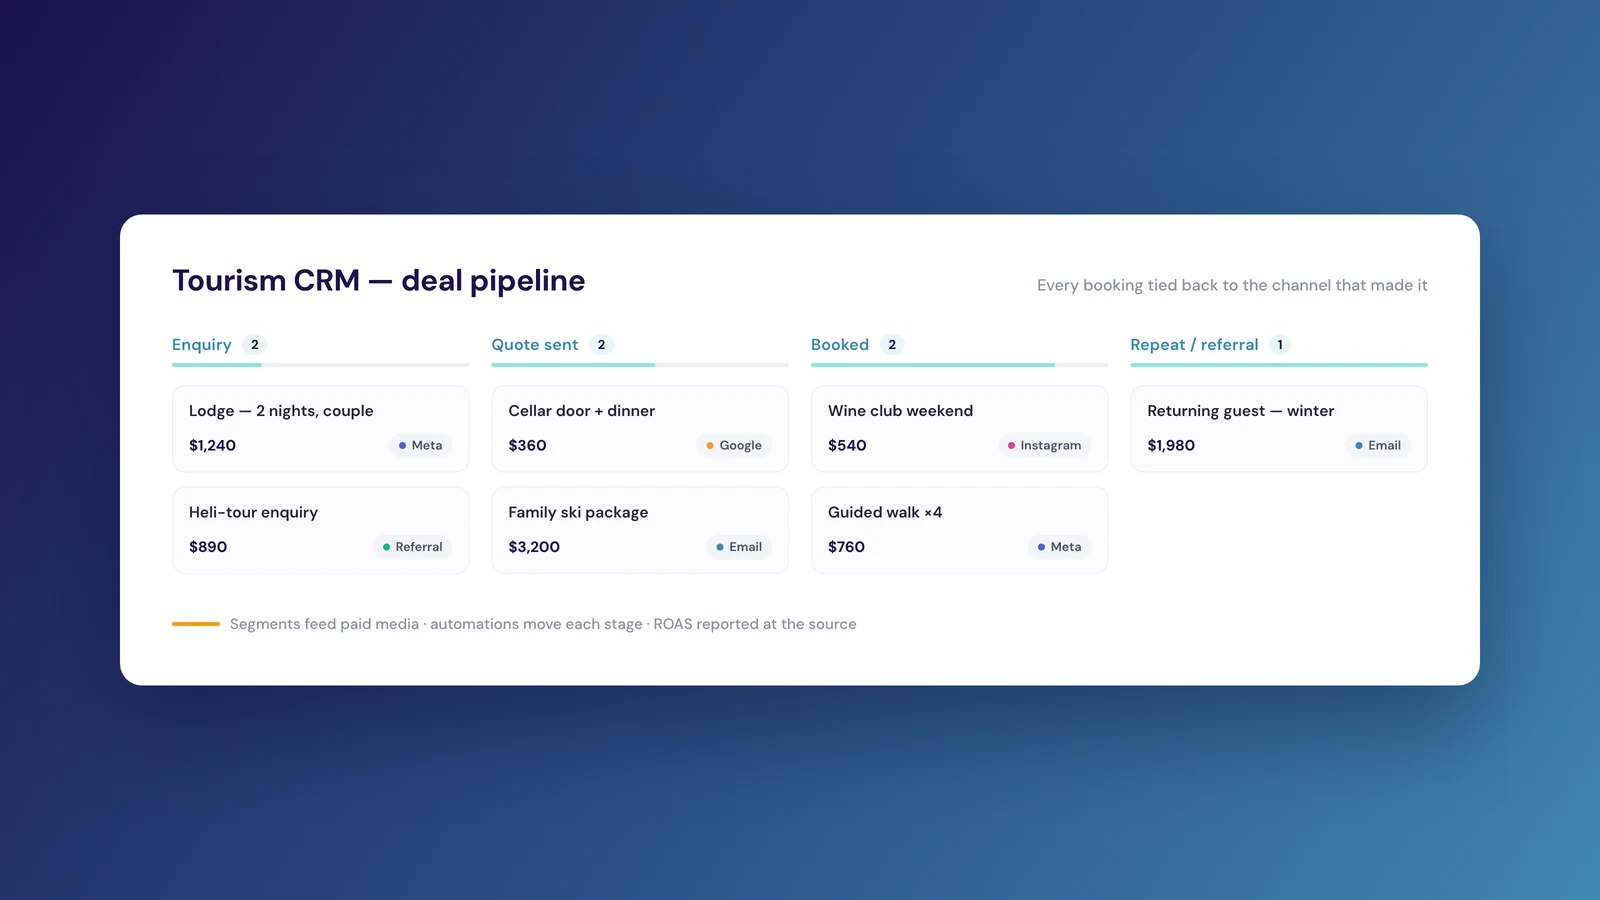
How we do CRM for destinations, experiences and tourism businesses
22 July 2026
For a tourism business, the difference between a CRM that holds contacts and one that drives revenue sits in a few specific places: attribution, audiences, automation and repeat bookings. How we refine each.
Read article
SEO & GEO
We have built a custom solution to the biggest challenge in destination marketing right now - AI Search Visibility
22 July 2026
See what AI tools say about your destination or experience today, then improve it. Our custom solution makes your visibility in AI search measurable across the customer journey, then gives you a plan to improve it.
Read article
SEO & GEO
Your destination is being recommended in AI. Can you see it?
21 July 2026
The trip now gets planned inside a chat, and most destinations have no way to see how they show up there. A GEO playbook for tourism boards, regions and luxury destinations: what to measure, and where to start this week.
Read article